Introduction to The California School Dashboard
THE CALIFORNIA SCHOOL DASHBOARD
https://www.caschooldashboard.org
The California School Dashboard is a new website that parents/guardians, educators and the public can use to see how districts and schools are meeting the needs of California's diverse student population based on multiple measures included in the new accountability system. The Dashboard will allow users to search by district or school and includes a set of easy-to-use reports showing district or school performance on 6 state indicators and 4 local indicators (6 for county offices of education) in different levels of detail.
WHAT ARE THE STATE INDICATORS?
Academic Indicator: Based on SBAC scale scores for student assessments on English Language Arts (ELA) and Mathematics for grades 3-8.
Suspension Rate Indicator: By grade span
English Learner Progress Indicator: Measures progress on English Learners toward EL proficiency (ELPAC scores) and incorporates data on reclassification rates.
High School Graduation Rate Indicator: Based on a four-year cohort.
College and Career Indicator: Grade 11 test scores on ELA and Mathematics and other measures of college and career readiness.
WHAT ARE THE LOCAL PERFORMANCE INDICATORS?
Appropriately Assigned Teachers, Access to Curriculum-Aligned Instructional Materials and Safe, Clean and Functional School Facilities (Priority 1)
Implementation of State Academic Standards (Priority 2)
Parent Engagement (Priority 3)
School Climate (Priority 6)
Coordination of Services for Expelled Students- County Offices Only (Priority 9)
Coordination of Services for Foster Youth- COE only (Priority 10)
Districts receive one of three performance levels for the local indicators: Met, Not Met and Not Met for Two or More Years. Meeting the standard on the local indicators is based on whether the district collected and reported performance data that must be collected locally for each local indicator. For districts that have Met the standard for these indicators, the performance data is available in the Detailed Reports. The local indicators do not apply to schools because they are based on district-level information and cannot be analyzed for individual schools.
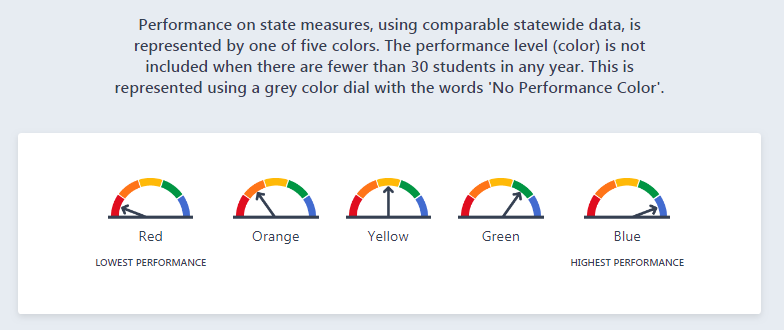
WHAT DO THE COLORS MEAN?
As depicted in the Dashboard and illustrated in the images below, schools and districts receive one of the five color coded performance levels on the STATE indicators. The overall performance level that district and schools receive is based on how current performance (Status) compares to past performance (change), which provides a more complete picture of performance than a point-in-time snapshot.
WHAT REPORTS ARE INCLUDED?
Users can choose from four different reports by selecting tabs underneath the demographic information. The information is summarized below.
Equity Report: This report shows the performance level of all students on the state indicators. This provides a simple overview of overall performance and whether any student groups are experiencing challenges on the state indicators.
Status and Change Report: This report shows the performance level for each state indicator and the current performance (STATUS) and difference from past performance (CHANGE) that resulted in that performance. It shows the data for Status and Change in addition to the color-coded performance level.
Detailed Reports: This tab includes reports that show the year-by-year data for the state indicators and additional state data that is relevant to he state indicators. For Districts, it also shows the locally collected data about progress on the local indicators. Users will see the data organized into three groupings: one focused on academic performance, one focused on academic engagement, and one focused on the school conditions and climate. The groupings reinforce the relationships among the indicators and will make the information more digestible.
Student Group Report: This report shows the performance of all students and each student group on the state indicators. Users can also choose to highlight only the student groups in the Blue and Green performance levels, the Yellow performance level, or the Orange and Red performance levels.
From any of the reports, users can also view reports showing performance of all students on a single indicator by clicking on that indicator. They can also select on any student group to access a single student group's performance on all indicators.
HOW IS THE NEW ACCOUNTABILITY SYSTEM DIFFERENT AND IMPROVED OVER THE API?
The new school accountability system defines a quality education more broadly than a single test score as used in the former Academic Performance Index (API). Equity is at the heart of the new accountability system, with an increased focus on addressing disparities among student groups across the concise set of measures. A more complete picture of student success will help school communities target resources where they are most needed.